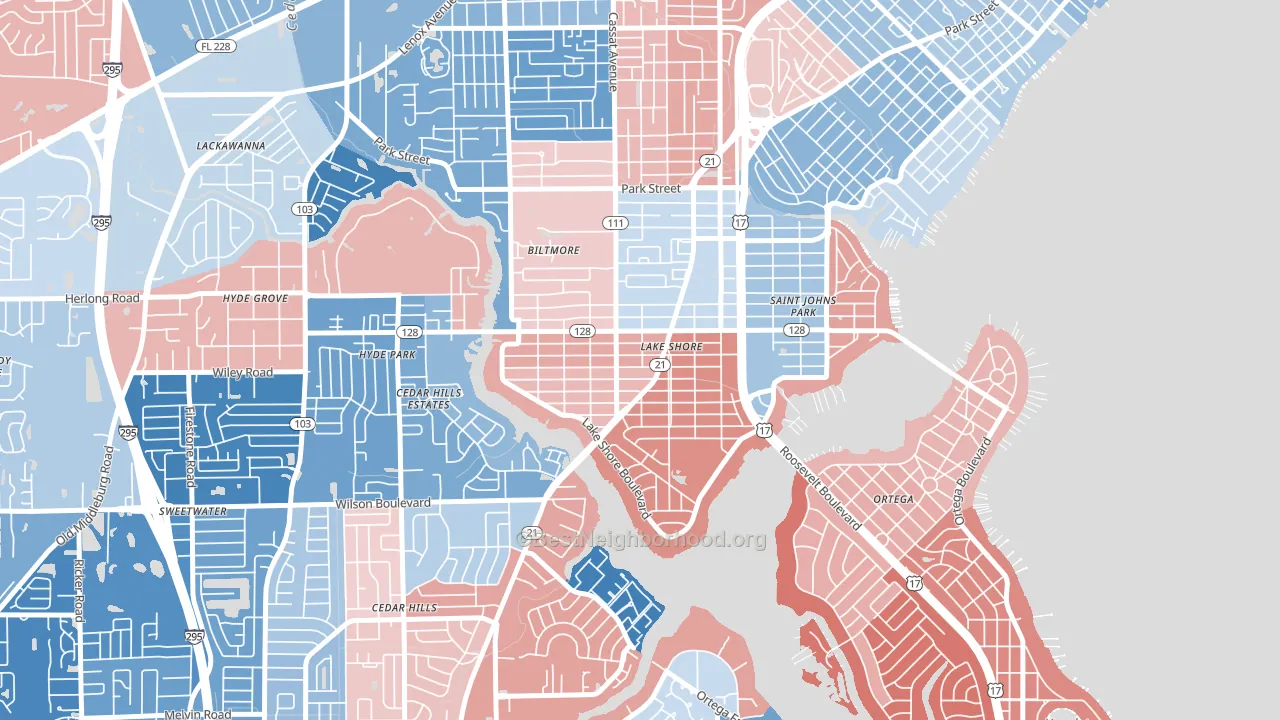
Lakeshore leans slightly Republican by roughly 14 points: about 43% of voters vote Democratic and 57% Republican.
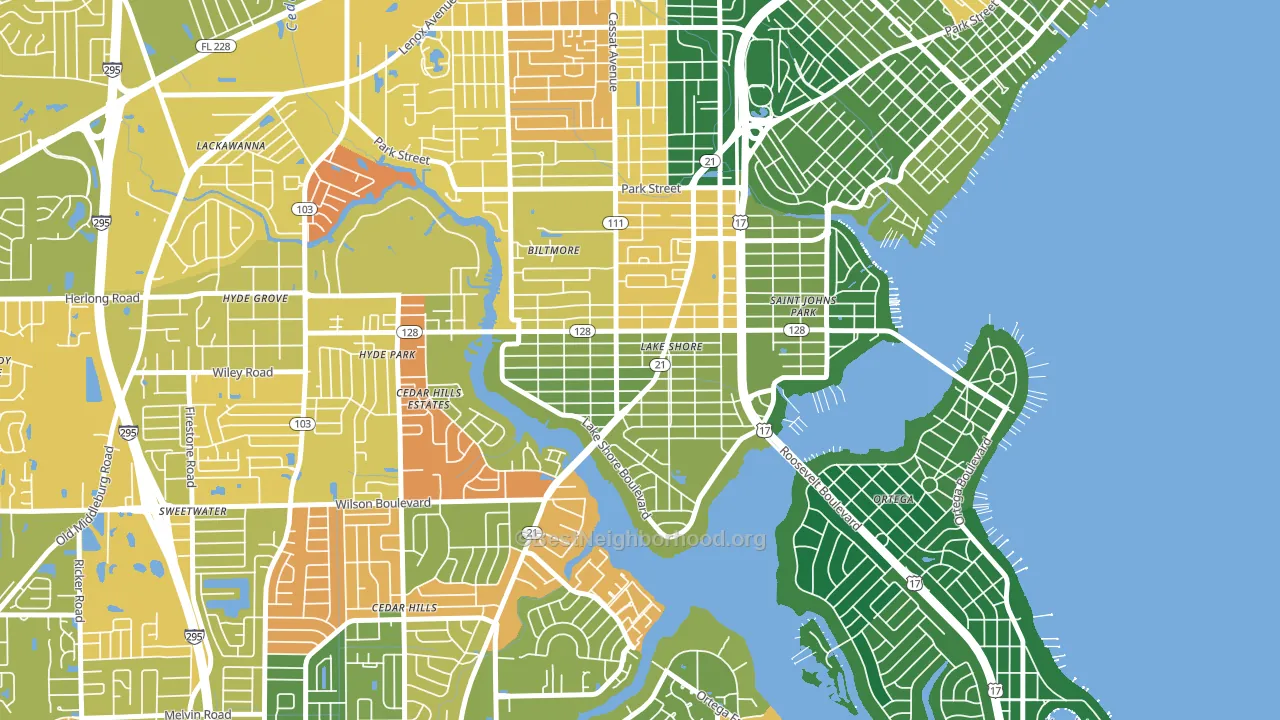
About 66% of adults in Lakeshore typically vote, near the U.S. average of about 62%. Among adults in Lakeshore, ~28% vote Democratic, ~38% Republican, and ~34% don't vote. The map below shows estimated turnout by block group.
How Lakeshore compares
Among neighborhoods within 5 miles, Lakeshore leans more Republican than 21 of 22 neighbors.
Politically, Lakeshore sits close to the rest of Florida.
Politics vary noticeably by block within Lakeshore. The southeast side is the most split-leaning (R+26) and the north side is the least split-leaning (Even), a spread of about 26 points.
Why Lakeshore leans the way it does
This analysis examined 14,881 data points per neighborhood to find what predicts political lean and turnout. The items below are a few correlations that stood out for Lakeshore, not a ranked or complete list of what matters most.
Car-dependent areas vote Republican. About 81% of residents in Lakeshore drive to work alone, about 7 points above the U.S. average of 74%. Low college attainment predicts Republican voting, and Lakeshore sits in the bottom quarter (about 17%, below 81% of neighborhoods).
Never-married share and voter turnout
Places with a low never-married share tend to turn out at a higher rate; Lakeshore, Jacksonville, FL sits below the national average on this measure.
Why turnout in Lakeshore looks the way it does
Turnout in Lakeshore sits close to the national pattern. Learn more about the findings and methodology on the political spectrum map.
Nearby Neighborhoods
- Cedar Hills Estates, Jacksonville, FL D+10
- Hillcrest, Jacksonville, FL D+24
- Confederate Point, Jacksonville, FL D+20
- Hyde Park, Jacksonville, FL D+31
- Avondale, Jacksonville, FL D+21
- Ortega Farms, Jacksonville, FL D+11
- Murray Hill, Jacksonville, FL D+10
- Cedar Hills, Jacksonville, FL D+17
- Wesconnett, Jacksonville, FL D+10
- Riverside, Jacksonville, FL D+27
Neighborhoods with Similar Populations
- Cielo Vista South, El Paso, TX D+20
- Bowman, Louisville, KY D+19
- Midtown, Oklahoma City, OK D+40
- Maple High-Six Corners, Springfield, MA D+44
- Thornwood, South Elgin, IL R+4
- The Lanes, Waltham, MA D+29
- Spring Creek, San Antonio, TX D+2
- Highlands, Manchester, NH D+11
- Westbrae, Berkeley, CA D+87
- Minnehaha, Spokane, WA R+6
Sources and methodology
Precinct-level voting records used to fit the model come from Florida Division of Elections, distributed by the Voting and Election Science Team. Demographic inputs come from the U.S. Census Bureau (ACS 5-year estimates and the 2020 Decennial Census). Health and environmental inputs come from the CDC (PLACES and the Environmental Justice Index). Land cover comes from the USGS and EPA. Election-day and lead-up weather come from PRISM 4km daily grids and the NOAA Global Historical Climatology Network. Mail-voting and election-administration patterns come from the MIT Election Lab's Survey of the Performance of American Elections. Block-group crime detail comes from CrimeGrade. Internet data and modeling support provided by ISPreports.org.
Modeling and analysis by the BestNeighborhood data science team. Full methodology and findings: political spectrum map.
Methodology reviewed by the BestNeighborhood data team. Last updated May 2026.