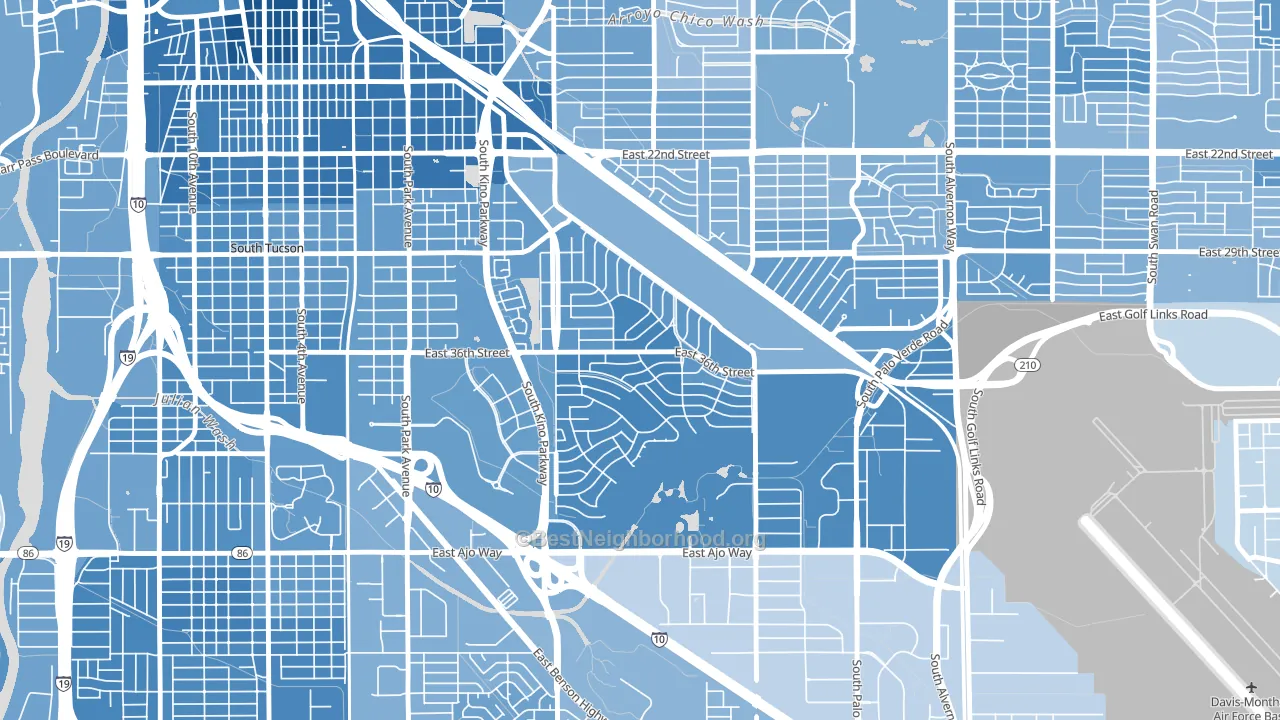
Las Vistas leans heavily Democratic by roughly 44 points: about 72% of voters vote Democratic and 28% Republican.
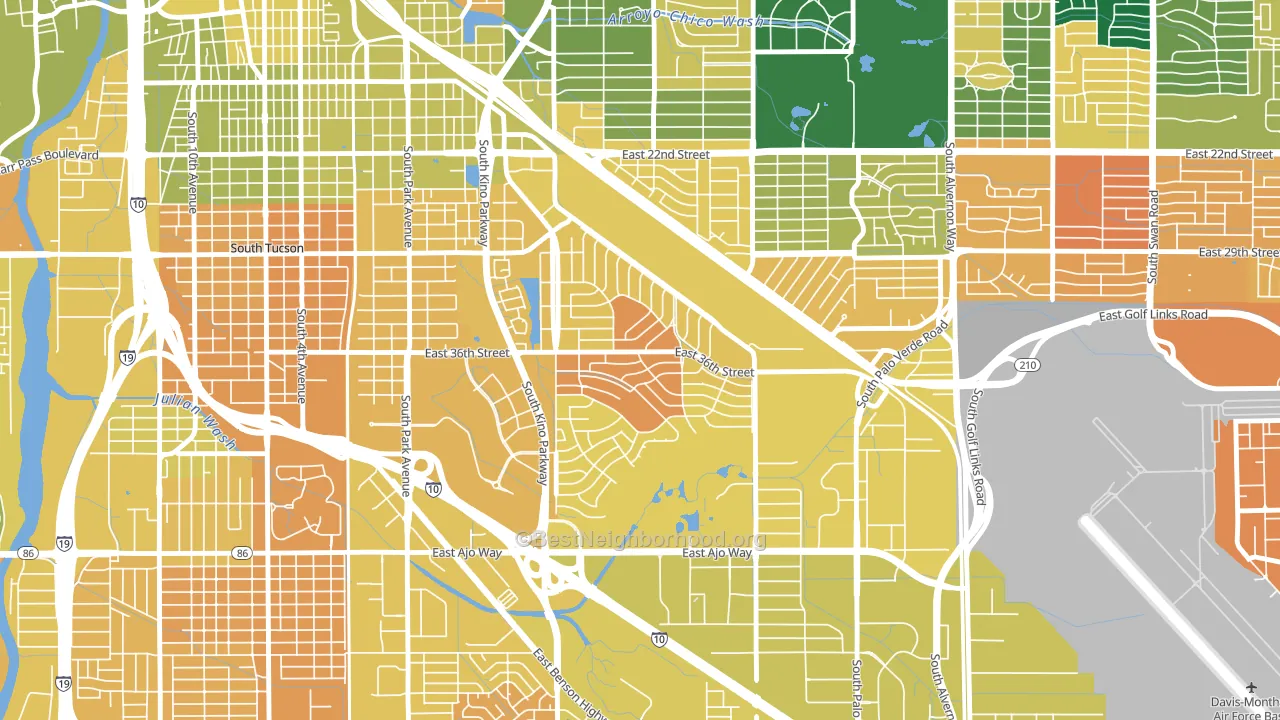
About 39% of adults in Las Vistas typically vote, below the U.S. average of about 62%. Among adults in Las Vistas, ~28% vote Democratic, ~11% Republican, and ~61% don't vote. The map below shows estimated turnout by block group.
How Las Vistas compares
Among neighborhoods within 5 miles, Las Vistas leans more Democratic than 15 of 23 neighbors.
Las Vistas runs about 49 points more Democratic than Arizona as a whole. Arizona leans Republican overall, while Las Vistas is one of the few Democratic-leaning pockets.
Why Las Vistas leans the way it does
This analysis examined 14,881 data points per neighborhood to find what predicts political lean and turnout. The items below are a few correlations that stood out for Las Vistas, not a ranked or complete list of what matters most.
Las Vistas votes against the grain of Arizona. Arizona leans Republican overall, while Las Vistas runs about 49 points more Democratic. A high never-married share predicts Democratic voting, and about 48% of adults in Las Vistas have never been married, above 78% of neighborhoods.
Population density and Democratic lean
Places with high population density tend to lean Democratic; Las Vistas, Tucson, AZ sits above the national average on this measure.
Why turnout in Las Vistas looks the way it does
Areas with limited routine healthcare access turn out at lower rates. Las Vistas is in the bottom quarter nationally for routine-care measures such as insurance coverage, preventive screenings, and dental visits. The dental-visit rate here is about 43%, about 12 points below the Arizona average of 54%. High food insecurity lines up with lower turnout, and about 30% of adults in Las Vistas report food insecurity, above 83% of neighborhoods. Low high-school completion lines up with lower turnout, and about 77% of adults in Las Vistas have completed high school, below 90% of neighborhoods. Learn more about the findings and methodology on the political spectrum map.
Nearby Neighborhoods
- South Park, Tucson, AZ D+38
- Julia Keen, Tucson, AZ D+33
- Bravo Park Lane, Tucson, AZ D+36
- Wakefield, Tucson, AZ D+43
- Sam Hughes, Tucson, AZ D+59
- Cherry Avenue, Tucson, AZ D+33
- Rincon Heights, Tucson, AZ D+57
- Rancho Buena, Tucson, AZ D+32
- Armory Park, Tucson, AZ D+59
- Miramonte, Tucson, AZ D+43
Neighborhoods with Similar Populations
- Huguenot, Richmond, VA D+21
- Nassau Shores, East Massapequa, NY R+33
- Stephens, Little Rock, AR D+71
- Augusta Street Area, Greenville, SC R+4
- Fair Oaks, North Fair Oaks, CA D+54
- Springfield, Jacksonville, FL D+51
- San Miguel, Sunnyvale, CA D+35
- Fourth Street Historic District, Massillon, OH R+6
- Marriott's Griffin Gate Golf Culb, Lexington, KY D+57
- South Amherst, Amherst, MA D+71
Sources and methodology
Precinct-level voting records used to fit the model come from Arizona Secretary of State, Elections, distributed by the Voting and Election Science Team. Demographic inputs come from the U.S. Census Bureau (ACS 5-year estimates and the 2020 Decennial Census). Health and environmental inputs come from the CDC (PLACES and the Environmental Justice Index). Land cover comes from the USGS and EPA. Election-day and lead-up weather come from PRISM 4km daily grids and the NOAA Global Historical Climatology Network. Mail-voting and election-administration patterns come from the MIT Election Lab's Survey of the Performance of American Elections. Block-group crime detail comes from CrimeGrade. Internet data and modeling support provided by ISPreports.org.
Modeling and analysis by the BestNeighborhood data science team. Full methodology and findings: political spectrum map.
Methodology reviewed by the BestNeighborhood data team. Last updated May 2026.