Sheldon leans slightly Republican by roughly 14 points: about 43% of voters vote Democratic and 57% Republican.
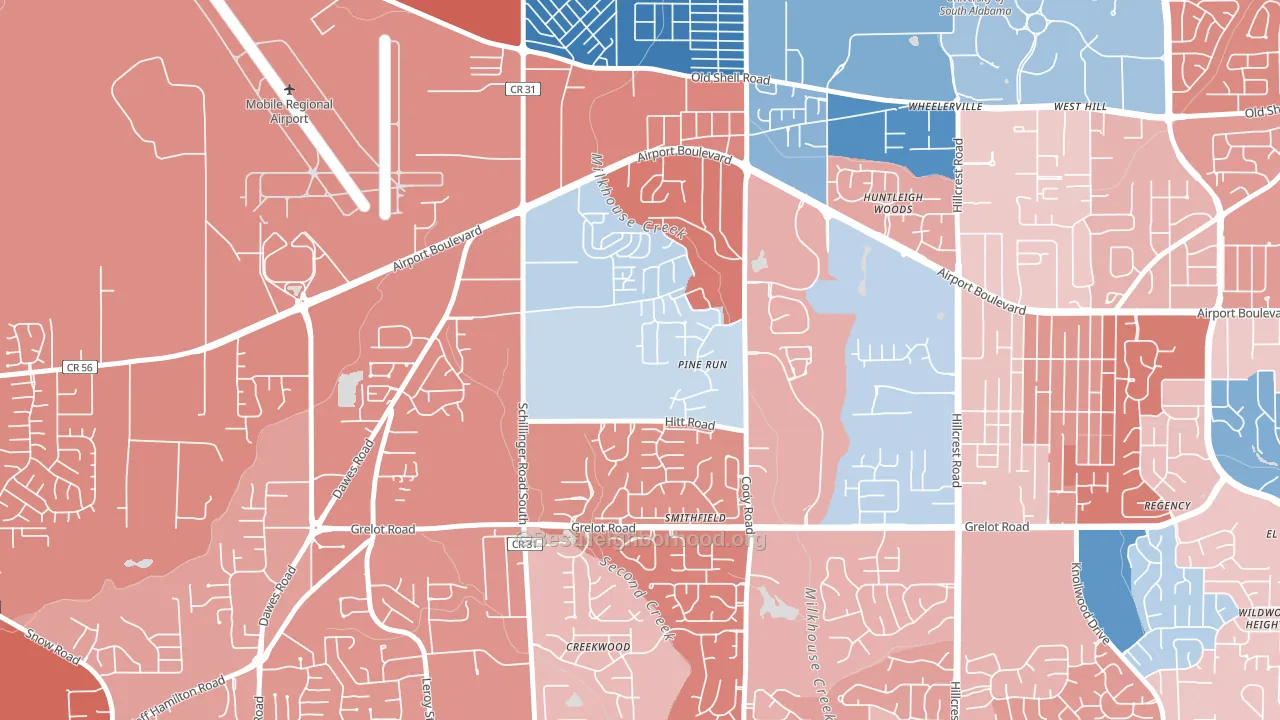
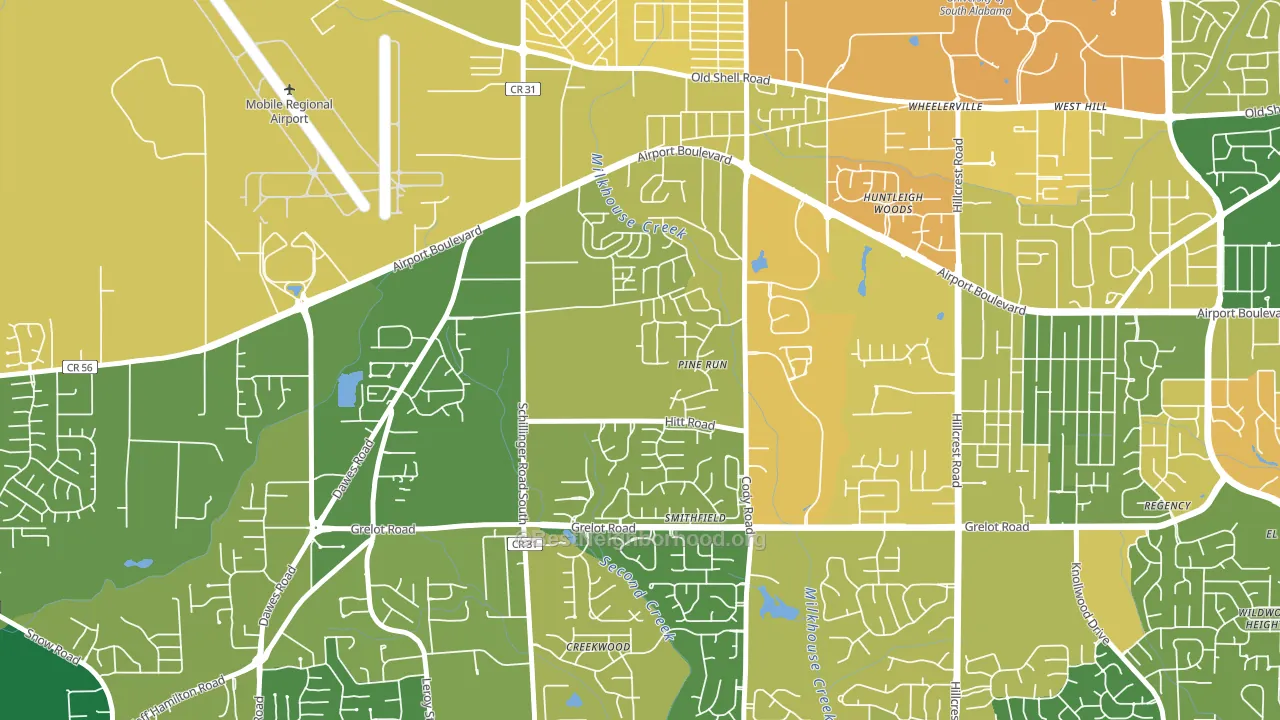
About 66% of adults in Sheldon typically vote, near the U.S. average of about 62%. Among adults in Sheldon, ~28% vote Democratic, ~38% Republican, and ~34% don't vote. The map below shows estimated turnout by block group.
How Sheldon compares
Among neighborhoods within 5 miles, Sheldon leans more Republican than 12 of 22 neighbors.
Sheldon runs about 17 points more Democratic than Alabama as a whole.
Politics vary noticeably by block within Sheldon. The northwest side runs the most Democratic (D+14) and the southwest side runs the most Republican (R+36), a spread of about 50 points.
Why Sheldon leans the way it does
This analysis examined 14,881 data points per neighborhood to find what predicts political lean and turnout. The items below are a few correlations that stood out for Sheldon, not a ranked or complete list of what matters most.
Car-dependent areas vote Republican. About 90% of residents in Sheldon drive to work alone, about 16 points above the U.S. average of 74%.
Cancer-screening access and voter turnout
Places with high colon-cancer-screening access tend to turn out at a higher rate; Sheldon, Mobile, AL sits in the top quarter nationally on this measure. Cancer screening does not drive turnout; it reflects income, insurance, and healthcare access.
Why turnout in Sheldon looks the way it does
Areas with high high-school completion turn out at higher rates. About 98% of adults in Sheldon have completed high school, about 12 points above the Alabama average of 86%. Learn more about the findings and methodology on the political spectrum map.
Nearby Neighborhoods
- Thornhill, Mobile, AL R+3
- Reichlieu, Mobile, AL D+21
- Second Creek, Mobile, AL R+21
- Overton, Mobile, AL R+8
- Yorkwood, Mobile, AL R+29
- Berkleigh, Mobile, AL R+24
- Westhill, Mobile, AL R+7
- Claremont, Mobile, AL R+18
- Baker, Mobile, AL R+29
- Malibar Heights, Mobile, AL D+14
Neighborhoods with Similar Populations
- Carver City-Lincoln Gardens, Tampa, FL D+23
- Riverside Rancho, Glendale, CA D+38
- Somerville, Manchester, NH D+26
- The Trails, Las Vegas, NV D+9
- Midtown, Tucson, AZ D+33
- Terra Nova, Chula Vista, CA D+14
- Chevy Chase, Glendale, CA D+3
- Creighton Village, Old Bridge, NJ R+24
- Whisman Station, Mountain View, CA D+45
- Clifton Heights, Louisville, KY D+44
Sources and methodology
Precinct-level voting records used to fit the model come from Alabama Secretary of State, Elections, distributed by the Voting and Election Science Team. Demographic inputs come from the U.S. Census Bureau (ACS 5-year estimates and the 2020 Decennial Census). Health and environmental inputs come from the CDC (PLACES and the Environmental Justice Index). Land cover comes from the USGS and EPA. Election-day and lead-up weather come from PRISM 4km daily grids and the NOAA Global Historical Climatology Network. Mail-voting and election-administration patterns come from the MIT Election Lab's Survey of the Performance of American Elections. Block-group crime detail comes from CrimeGrade. Internet data and modeling support provided by ISPreports.org.
Modeling and analysis by the BestNeighborhood data science team. Full methodology and findings: political spectrum map.
Methodology reviewed by the BestNeighborhood data team. Last updated May 2026.