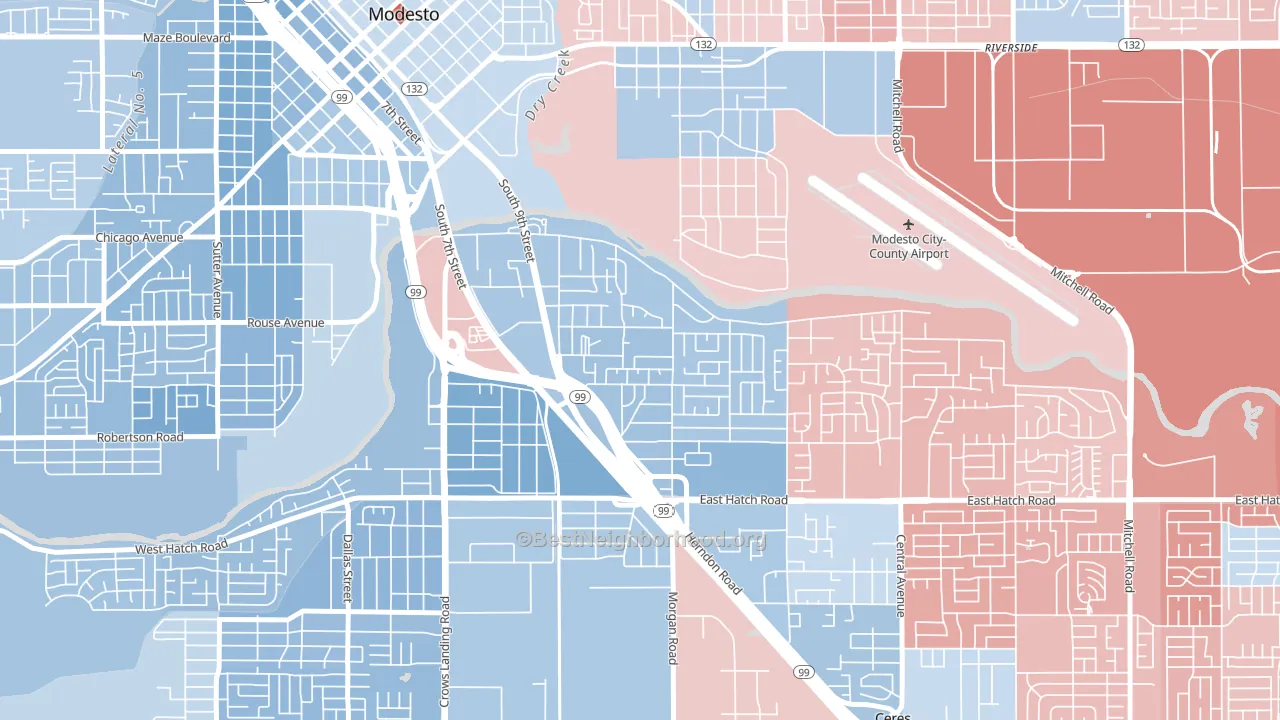
Bystrom leans Democratic by roughly 16 points: about 58% of voters vote Democratic and 42% Republican.
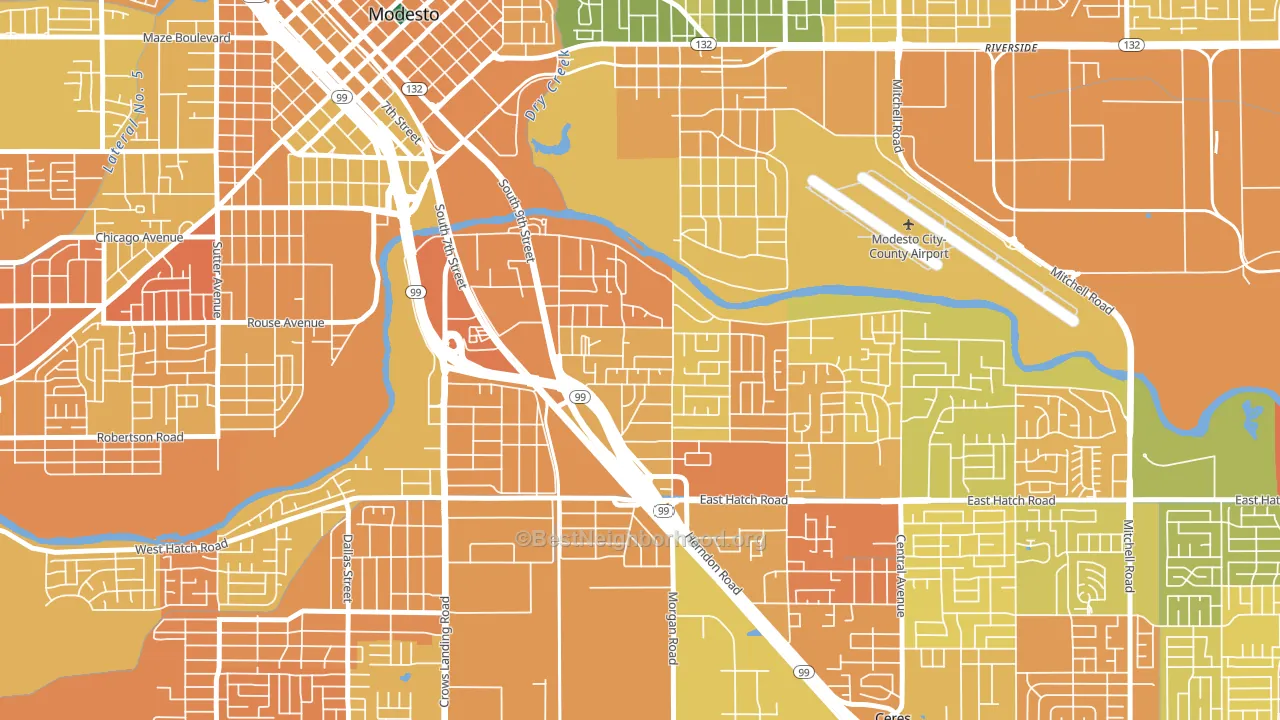
About 35% of adults in Bystrom typically vote, below the U.S. average of about 62%. Among adults in Bystrom, ~20% vote Democratic, ~15% Republican, and ~65% don't vote. The map below shows estimated turnout by block group.
How Bystrom compares
Among neighborhoods within 5 miles, Bystrom leans more Democratic than 2 of 5 neighbors.
Bystrom runs about 5 points more Republican than California as a whole.
Why Bystrom leans the way it does
Density, race composition, education, and family structure all sit close to their national averages in Bystrom. The lean here lands roughly where demographic data alone would predict.
Paved land cover and Democratic lean
Places with extensive paved surfaces tend to lean Democratic; Bystrom, Modesto, CA sits in the top quarter nationally on this measure. Paved ground does not change how people vote; it mostly reflects how urban and built-up a place is.
Why turnout in Bystrom looks the way it does
Areas with limited routine healthcare access turn out at lower rates. Bystrom is in the bottom quarter nationally for routine-care measures such as insurance coverage, preventive screenings, and dental visits. The dental-visit rate here is about 41%, about 21 points below the California average of 62%. High food insecurity lines up with lower turnout, and about 43% of adults in Bystrom report food insecurity, above 95% of neighborhoods. Low high-school completion lines up with lower turnout, and about 66% of adults in Bystrom have completed high school, below 96% of neighborhoods. Learn more about the findings and methodology on the political spectrum map.
Nearby Neighborhoods
- Shackelford, Modesto, CA D+18
- South Modesto Acres, Modesto, CA D+21
- Downtown Modesto, Modesto, CA D+18
- West Modesto, Modesto, CA D+8
- Mayfield, Ceres, CA R+25
- Crossroads-Riverbank, Riverbank, CA R+19
- Downtown Turlock, Turlock, CA Even
- Downtown Waterford, Waterford, CA R+23
- Downtown Oakdale, Oakdale, CA R+17
- Downtown Newman, Newman, CA R+3
Neighborhoods with Similar Populations
- Dogtown, Selinsgrove, PA R+2
- Meredith, Des Moines, IA D+17
- New Aurora, New Orleans, LA D+57
- Arlington Heights, Arlington, MA D+63
- Holmes-Foster Historic District, State College, PA D+47
- Happy Valley, Anderson, CA R+43
- South Akron, Akron, OH D+39
- Burnt Bridge Creek, Vancouver, WA Even
- Saint Edwards, Austin, TX D+57
- Carson Square, Indianapolis, IN R+6
Sources and methodology
Precinct-level voting records used to fit the model come from California Secretary of State, Elections, distributed by the Voting and Election Science Team. Demographic inputs come from the U.S. Census Bureau (ACS 5-year estimates and the 2020 Decennial Census). Health and environmental inputs come from the CDC (PLACES and the Environmental Justice Index). Land cover comes from the USGS and EPA. Election-day and lead-up weather come from PRISM 4km daily grids and the NOAA Global Historical Climatology Network. Mail-voting and election-administration patterns come from the MIT Election Lab's Survey of the Performance of American Elections. Block-group crime detail comes from CrimeGrade. Internet data and modeling support provided by ISPreports.org.
Modeling and analysis by the BestNeighborhood data science team. Full methodology and findings: political spectrum map.
Methodology reviewed by the BestNeighborhood data team. Last updated May 2026.