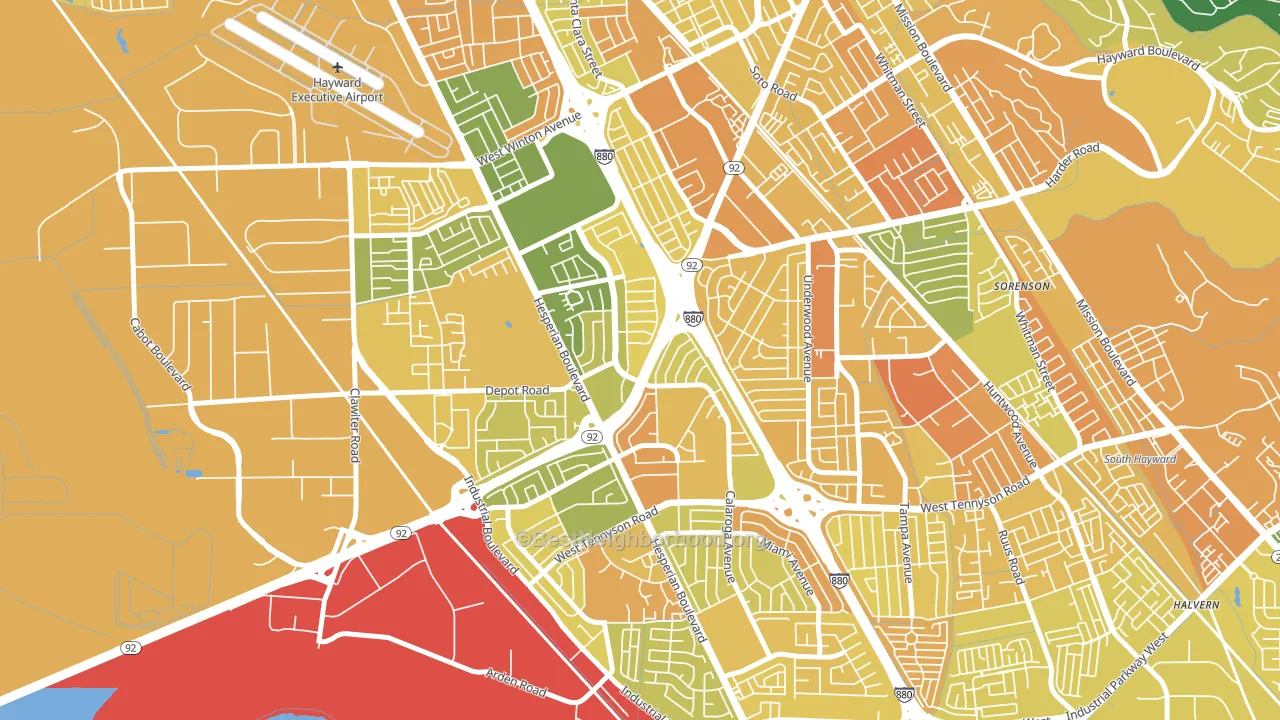
Southgate leans heavily Democratic by roughly 38 points: about 69% of voters vote Democratic and 31% Republican.
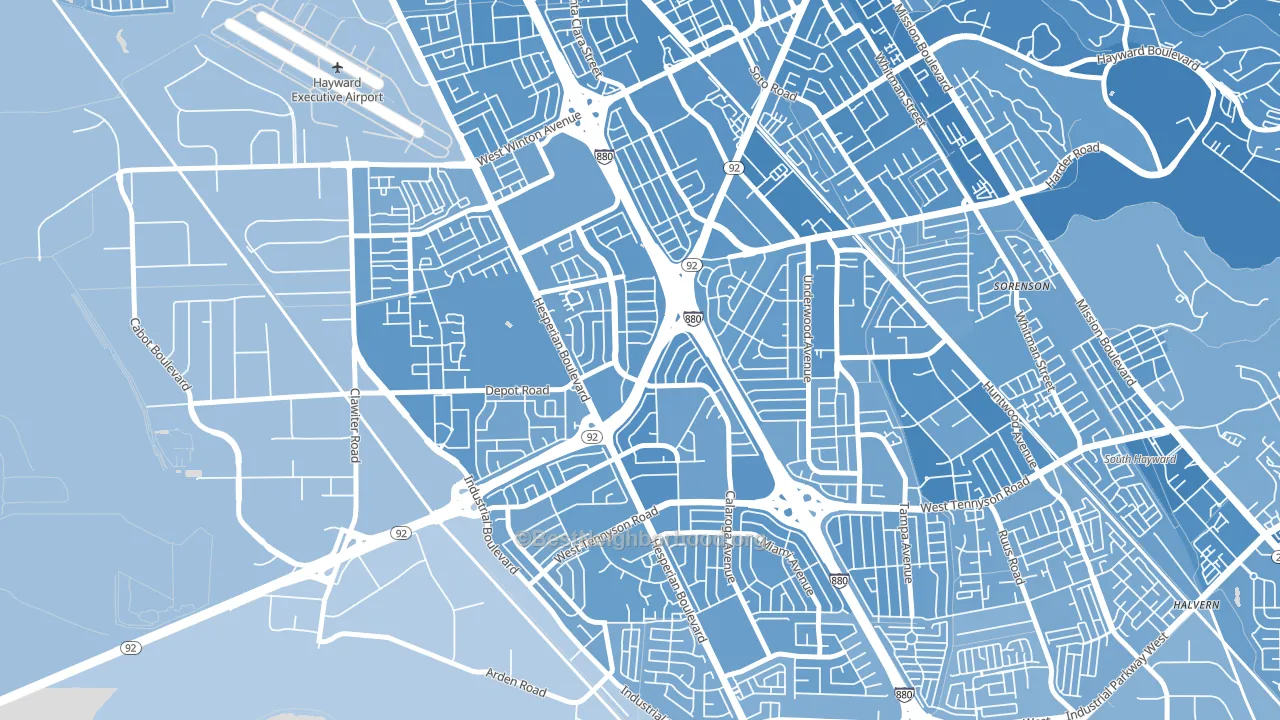
About 52% of adults in Southgate typically vote, below the U.S. average of about 62%. Among adults in Southgate, ~36% vote Democratic, ~16% Republican, and ~48% don't vote. The map below shows estimated turnout by block group.
How Southgate compares
Among neighborhoods within 5 miles, Southgate leans more Democratic than 12 of 20 neighbors.
Southgate runs about 19 points more Democratic than California as a whole.
Why Southgate leans the way it does
This analysis examined 14,881 data points per neighborhood to find what predicts political lean and turnout. The items below are a few correlations that stood out for Southgate, not a ranked or complete list of what matters most.
Dense areas vote Democratic. More than 99% of residents in Southgate live in densely developed areas, about 64 points above the U.S. average of 36%.
Walkability and Democratic lean
Places with a highly walkable street grid tend to lean Democratic; Southgate, Hayward, CA sits in the top quarter nationally on this measure. A walkable street grid does not change how people vote; it mostly reflects how urban a place is.
Why turnout in Southgate looks the way it does
Crowded housing lines up with lower turnout. About 13% of homes in Southgate have more than one occupant per room, above 95% of neighborhoods. Learn more about the findings and methodology on the political spectrum map.
Nearby Neighborhoods
- Mt Eden, Hayward, CA D+30
- Glen Eden, Hayward, CA D+33
- Harder-Tennyson, Hayward, CA D+37
- Jackson Triangle, Hayward, CA D+38
- Santa Clara Street, Hayward, CA D+39
- Whitman-Mocine, Hayward, CA D+33
- Longwood-Winton Grove, Hayward, CA D+37
- Burbank-Hayward, Hayward, CA D+42
- Tennyson-Alquire, Hayward, CA D+35
- Mission-Foothill, Hayward, CA D+43
Neighborhoods with Similar Populations
- Abbott McKinley, Buffalo, NY D+16
- North Quinsigamond Village, Worcester, MA D+37
- Carondelet, St. Louis, MO D+51
- University of NC at Chapel Hill, Chapel Hill, NC D+72
- North Lamar, Austin, TX D+37
- Queensborough, Shreveport, LA D+84
- Central City Santa Ana, Santa Ana, CA D+32
- Duncan Park, Lexington, KY D+68
- Bronze Boot, Phoenix, AZ D+36
- Euclid-St Paul, St. Petersburg, FL D+18
Sources and methodology
Precinct-level voting records used to fit the model come from California Secretary of State, Elections, distributed by the Voting and Election Science Team. Demographic inputs come from the U.S. Census Bureau (ACS 5-year estimates and the 2020 Decennial Census). Health and environmental inputs come from the CDC (PLACES and the Environmental Justice Index). Land cover comes from the USGS and EPA. Election-day and lead-up weather come from PRISM 4km daily grids and the NOAA Global Historical Climatology Network. Mail-voting and election-administration patterns come from the MIT Election Lab's Survey of the Performance of American Elections. Block-group crime detail comes from CrimeGrade. Internet data and modeling support provided by ISPreports.org.
Modeling and analysis by the BestNeighborhood data science team. Full methodology and findings: political spectrum map.
Methodology reviewed by the BestNeighborhood data team. Last updated May 2026.